

Share this tool:
Description:
Rows AI is a spreadsheet-based AI analyst for people who want to analyze data without spending most of their time writing formulas, building SQL queries, or moving data between tools. It keeps the familiar spreadsheet format, then adds AI for importing data, transforming tables, generating charts, cleaning messy inputs, and answering questions in plain language.
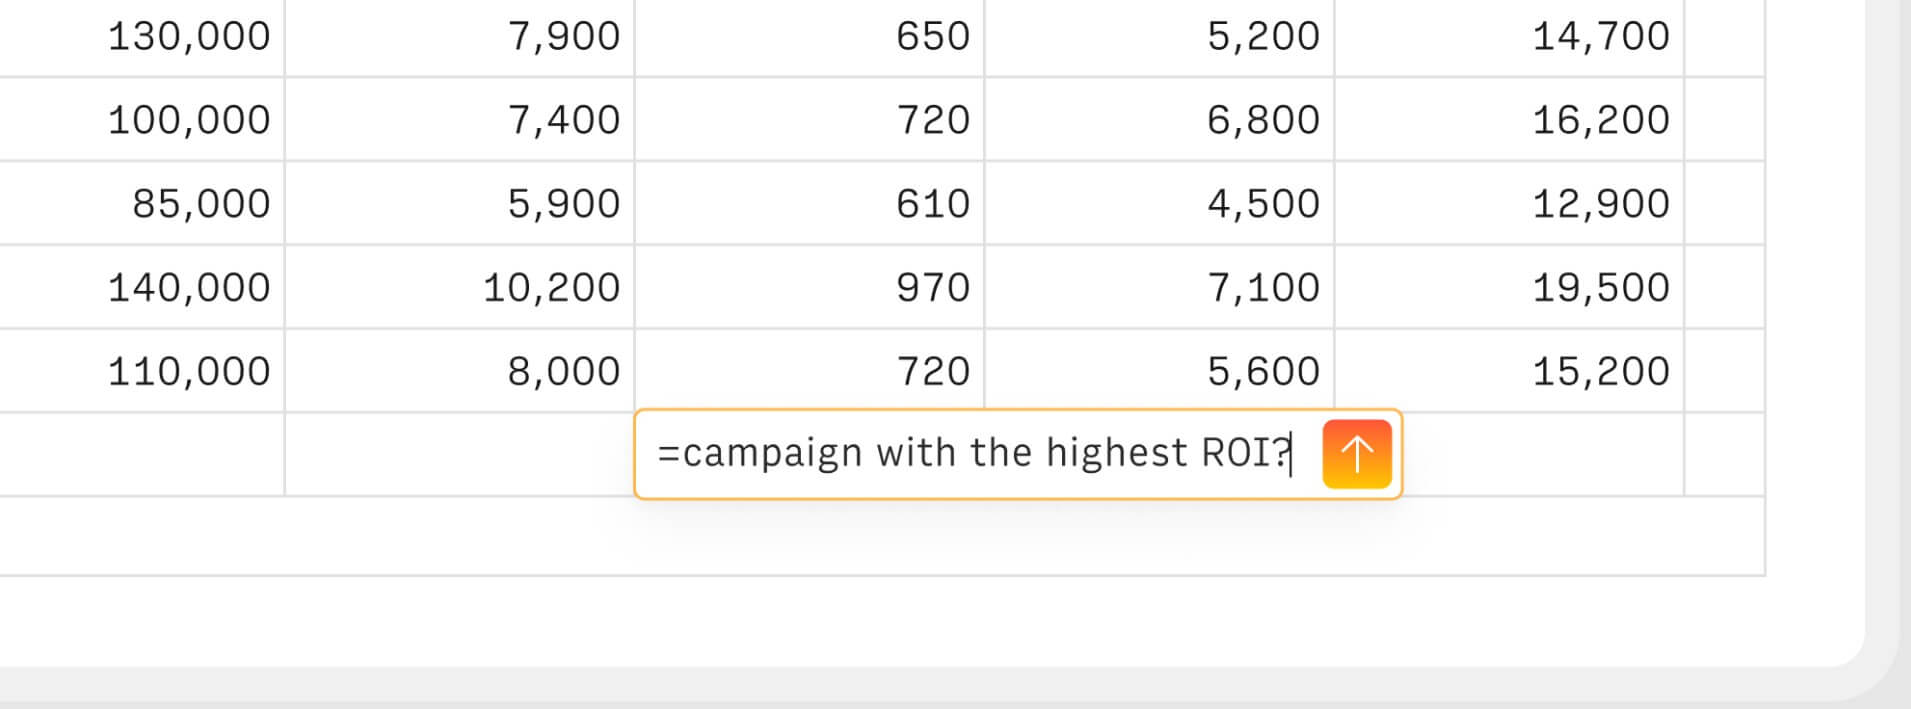
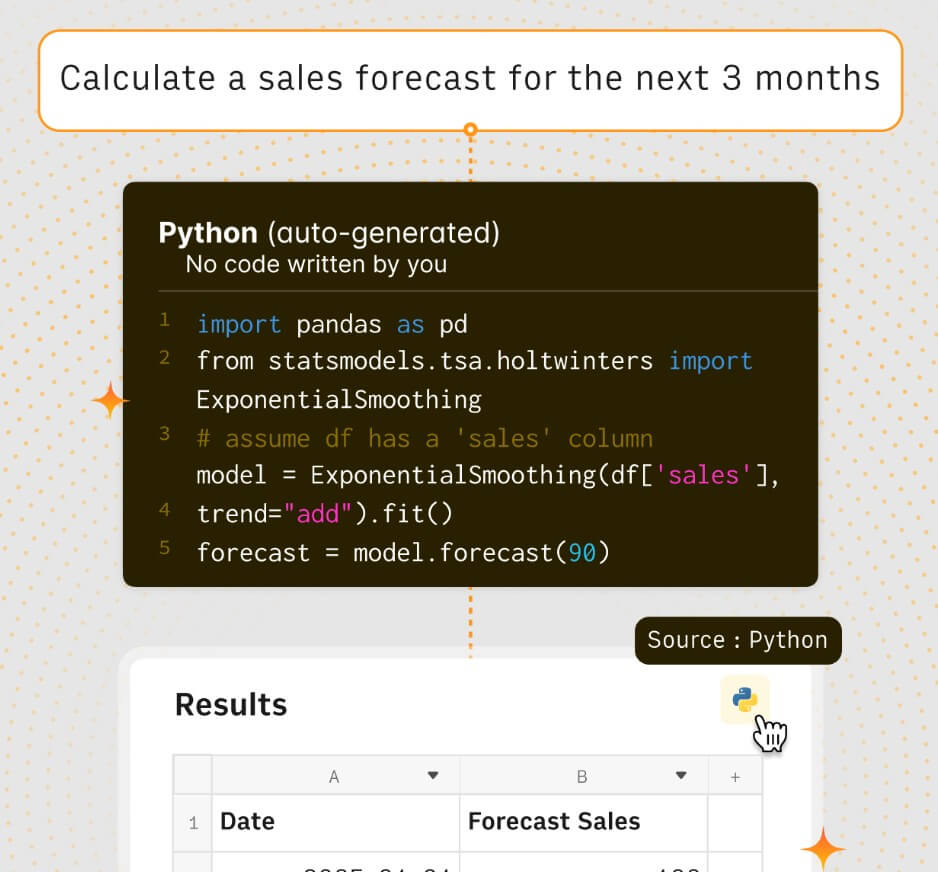
Rows is an online spreadsheet with built-in AI and integrations. The AI layer is not bolted on as a separate chat window only. It works inside the spreadsheet itself. Rows says users can type = in a cell and describe what they need, such as fixing formulas, creating charts, extracting insights, or adding formula columns.
That design choice matters. Rows AI is not trying to replace spreadsheets. It is trying to make spreadsheet work less manual. Users can still work with tables, cells, formulas, dashboards, and charts, but AI can handle much of the setup, cleanup, and analysis.
The broader Rows product is aimed at importing data from PDFs, business tools, databases, APIs, analytics platforms, and other sources, then analyzing it through plain language. Rows describes the workflow as extracting data, creating reports, merging datasets, and running advanced analysis without relying on BI dashboards or SQL queries.
Rows AI is strongest when the user already thinks in spreadsheets but wants to move faster. That includes marketers pulling ad results, founders tracking SaaS metrics, operators cleaning exports, sales teams reviewing pipeline data, analysts preparing reports, and freelancers building calculators or dashboards for clients.
Its best use case is not deep enterprise BI governance. It is practical data work: import a table, clean it, enrich it, ask questions, generate summaries, build charts, and share a live report. Rows keeps the flexibility of a spreadsheet while adding enough AI to reduce the formula and menu work that slows many users down.
| Feature | What it does | Why it matters |
|---|---|---|
| AI Analyst | Answers spreadsheet questions and performs analysis from table context | Makes data exploration easier for non-technical users |
| AI in cells | Lets users type natural-language instructions directly into cells | Keeps AI close to the spreadsheet workflow |
| Formula columns | Creates calculated columns without manually writing formulas | Helps users build working tables faster |
| Data transformation | Cleans, summarizes, slices, merges, and reconciles tables | Reduces repetitive spreadsheet cleanup |
| Document and image extraction | Extracts tables and text from PDFs, screenshots, and scans | Useful when data starts outside spreadsheets |
| Built-in integrations | Imports live data from business tools and data sources | Reduces copy-paste reporting work |
Rows says its AI can help ingest data from documents and images, import data from third-party tools, transform data, summarize tables, clean messy inputs, merge datasets, explore insights, run advanced analysis, enrich data, and generate sample datasets or spreadsheet models.
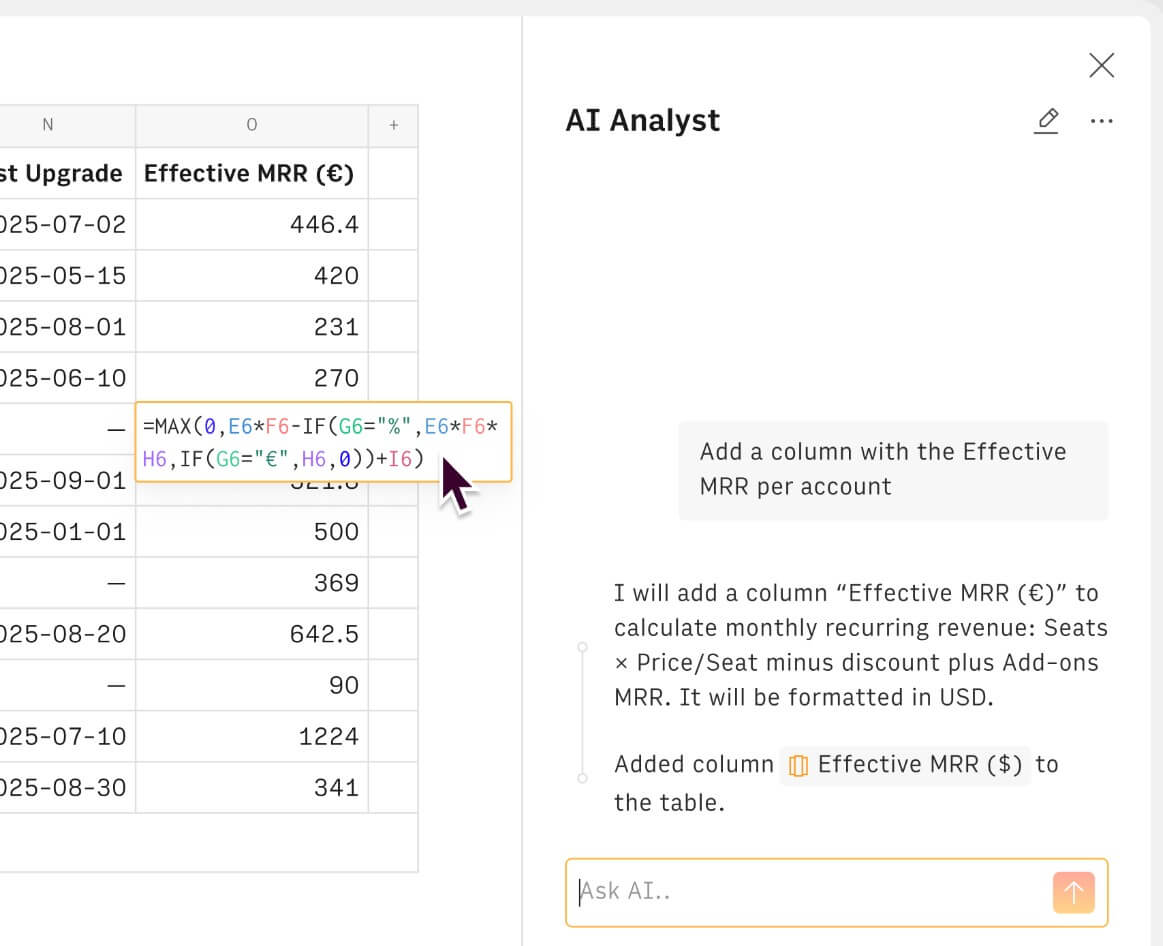
The AI Analyst is the center of Rows AI. Rows documentation says the Analyst understands datasets from headers and a sample of rows. That means it can infer useful operations from column names and example data. If a table has cost and revenue columns, for example, users can ask it to compute profit without first writing the formula themselves.
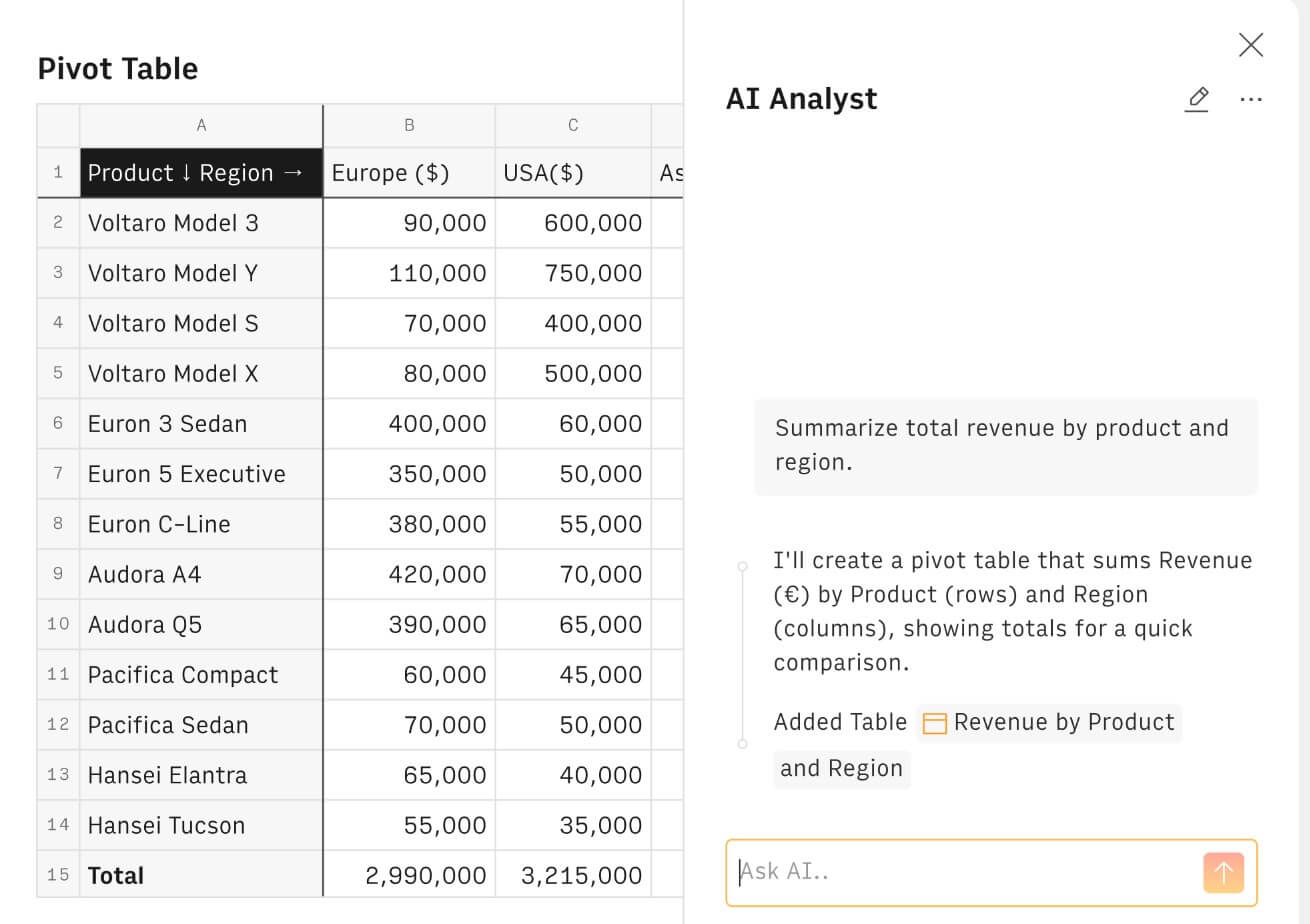
This is useful because most business users do not struggle with the concept of analysis. They struggle with the mechanics. They know they want revenue by category, top products by region, customer breakdowns, or median values by segment. Rows AI can turn that kind of request into spreadsheet actions.
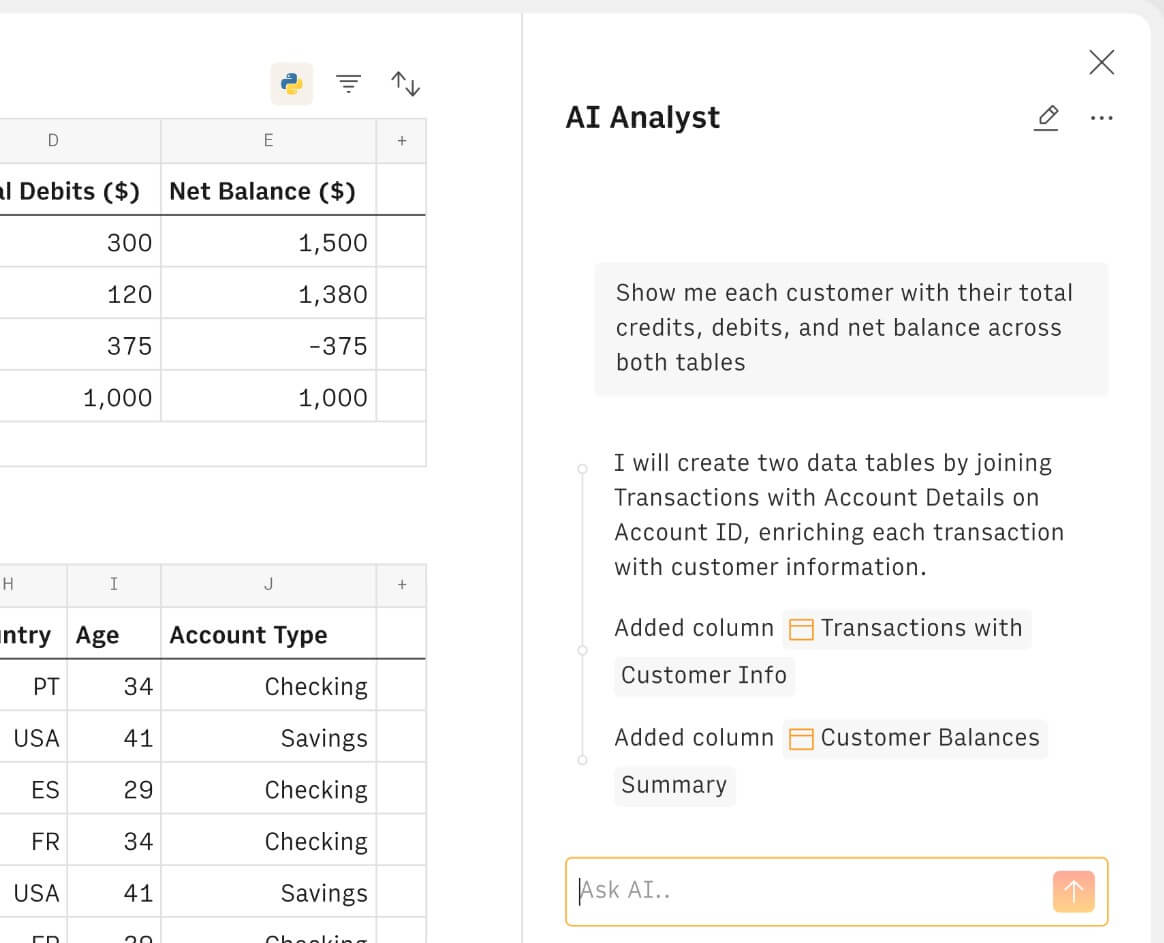
The Analyst can also work across tables. Rows says it can analyze any table in a spreadsheet and perform cross-table lookups, merges, and combinations, with users able to reference a specific table using the @ symbol in a prompt. That makes Rows more useful than a one-table summarizer. Many real reports require joining campaign spend to conversions, customer records to invoices, or product lists to order history.
Rows becomes more interesting when it is connected to live data. Its integrations page lists a wide range of sources, including Google Analytics 4, Google Search Console, Google Ads, Facebook Ads, LinkedIn Ads, YouTube, TikTok, HubSpot, Salesforce, Stripe, PostgreSQL, MySQL, BigQuery, Snowflake, Airtable, Notion, Slack, Gmail, Make, Zapier, and more.
That integration layer is a major advantage over a basic spreadsheet. A marketing team can pull ad platform data. A sales team can work with CRM data. A finance or ops team can import database or billing data. Rows also says data can be refreshed automatically, from every minute to every month, which makes it useful for live reporting rather than one-time analysis. The practical benefit is simple: less exporting, less CSV stitching, and fewer stale reports.
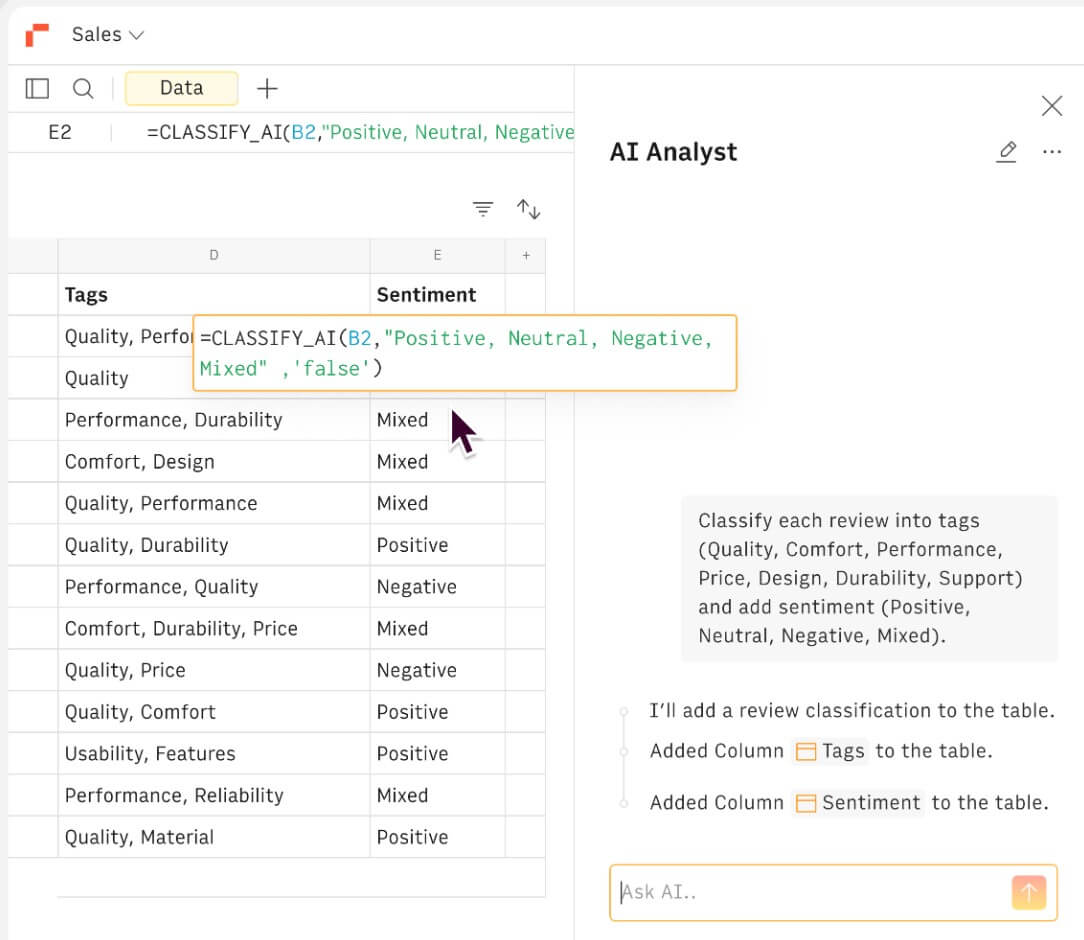
Rows AI is not limited to numeric analysis. The Rows AI integration page describes language tasks such as summarization, classification, translation, question answering, and text generation. Its listed functions include classifying text into tags or sentiment, extracting elements from text, rewriting, summarizing, translating, generating product titles, creating meta descriptions, and producing advertising content from product descriptions.
This is helpful for workflows where spreadsheet rows contain messy text. A marketer can classify campaign ideas. A support team can tag feedback. An ecommerce team can generate product descriptions. A researcher can summarize notes. The value is not that Rows becomes the best writing tool. The value is that AI can run across rows in a table.
Rows also works as a lightweight reporting tool. The product page says users can build reports and interactive dashboards, share them across devices, embed them elsewhere, and keep the underlying data up to date. It gives examples such as adding marketing results to a Notion doc, putting a pricing calculator on a website, or embedding a chart in a blog post.
This makes Rows useful for client reporting, internal dashboards, startup metric pages, marketing performance reports, calculators, and simple public-facing data tools. It is not a full BI platform, but it is much easier to shape than many BI dashboards.
Rows says it does not use user data to train models for others. Its AI page also says it shares only limited information with the model: table headers, a sample of up to five rows, and basic statistics such as minimum and maximum values. Rows says it uses a combination of OpenAI GPT models, Llama, and other LLMs, and that users cannot currently choose a different model for the AI Analyst.
That is useful to know for evaluation. Teams working with sensitive data should still review security and privacy requirements carefully, but Rows is at least explicit about what it sends to AI systems.
Rows AI is a strong fit for marketing reporting, especially when teams need to pull data from ads, analytics, search, social, and spreadsheets into one working report.
It is also useful for startup metrics, SaaS dashboards, product usage summaries, CRM cleanup, sales pipeline analysis, lead enrichment, customer segmentation, and lightweight financial models.
Agencies can use it for client dashboards and repeatable reporting templates. Solo operators can use it to build calculators, scrape or import public data, clean CSV files, and analyze small business performance.
Rows AI is still a spreadsheet tool, so it works best when the user’s data is table-shaped. If the project requires strict data governance, complex semantic layers, large enterprise BI permissions, or deep warehouse modeling, a dedicated BI or analytics platform may be more appropriate.
The AI Analyst also depends on headers, row samples, and clear table structure. Messy column names, inconsistent values, and unclear data relationships can weaken results. Users should still check outputs, especially when Rows creates formulas, joins tables, or performs advanced analysis.
Finally, model selection is not user-controlled for the AI Analyst. Rows uses a curated set of models, which keeps the experience simpler but may disappoint teams that want direct control over model choice.
Rows AI is best for people who live in spreadsheets but want faster analysis, cleaner reporting, and easier access to business data. Its strongest value is the combination of AI Analyst, cell-level AI, formula generation, document extraction, text classification, live integrations, and shareable reports. It is a strong fit for marketers, founders, operators, analysts, agencies, and small teams that need flexible reporting without heavy BI setup. The main caveat is data structure. Rows AI works best when your tables are clean, your questions are specific, and you still review the results before using them for important decisions.
TAGS: Productivity
Related Tools:

Automates code reviews, testing, and merges to help engineering teams

Enhances writing productivity

Helps users create and manage their daily tasks

Transforms voice recordings into organized notes
Uses AI to analyze, automate, and visualize data

Enhances the process of online course creation