Share this tool:
Description:
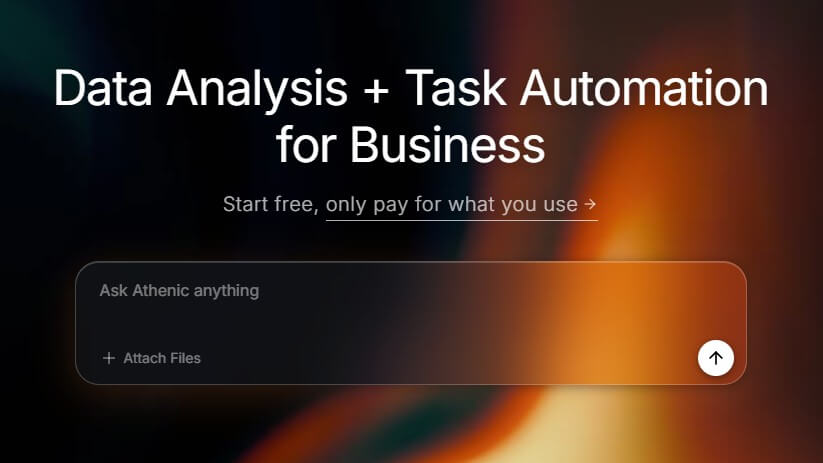
Athenic AI is an AI data analyst and business intelligence tool for teams that want faster access to data without making every question wait on an analyst or SQL expert. Its main value is not just “chat with your data.” The stronger point is that Athenic combines natural-language querying, SQL generation, dashboards, governed metric definitions, and a Knowledge Graph that teaches the AI how your business data should be interpreted.
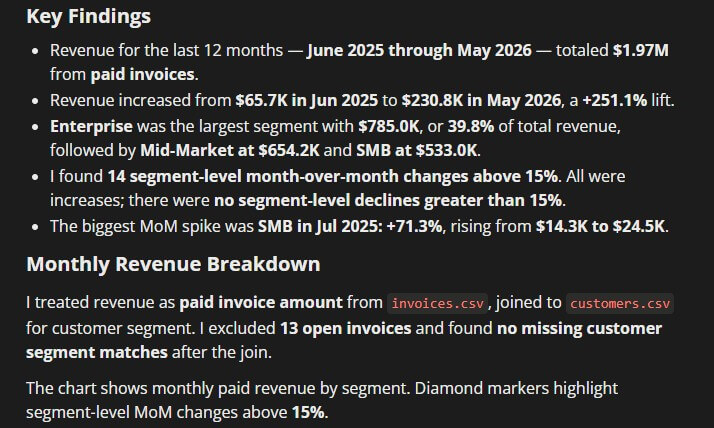
I only tested Prompt 1 using the sample data pack below. Users can download the same test data and try the rest of the prompts themselves inside Athenic AI.
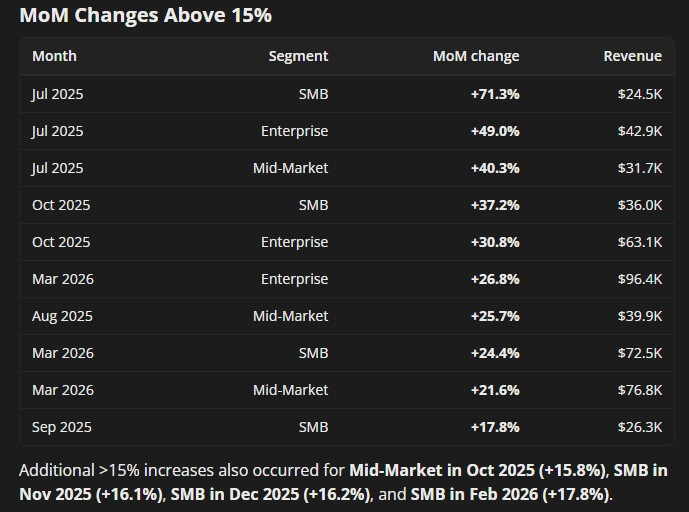
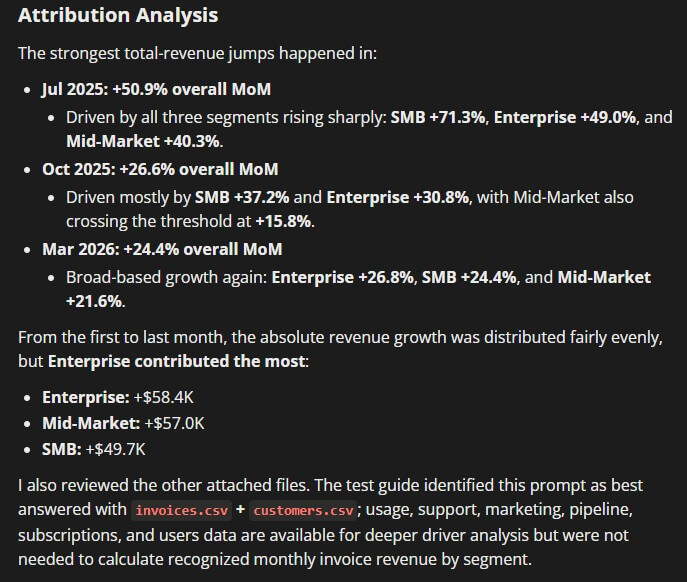
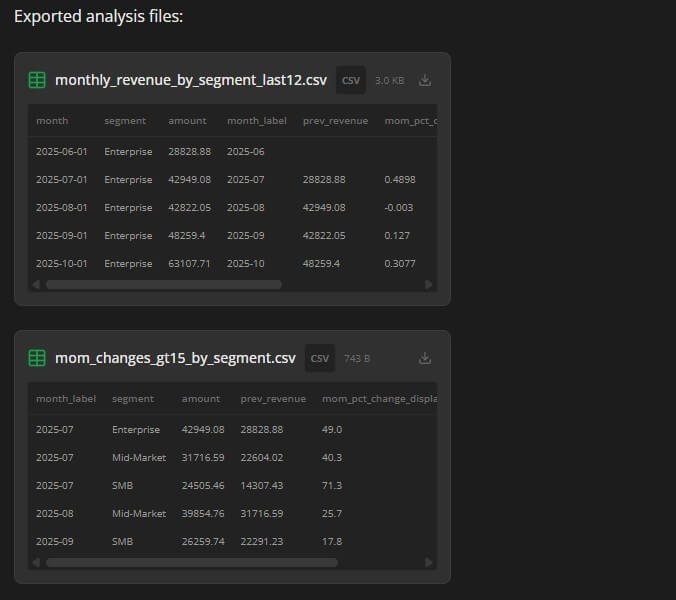
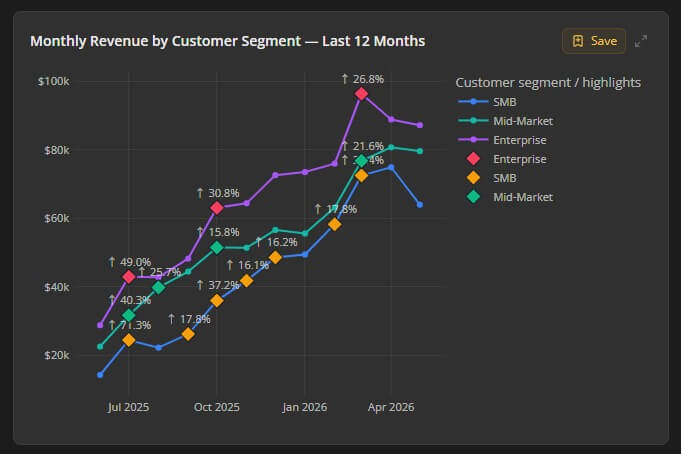
“Show monthly revenue for the last 12 months. Break it down by customer segment and highlight any month-over-month changes above 15%.”
Status: Tested with the sample data pack.
“What were the biggest drivers of revenue growth last quarter? Break the answer down by product, customer segment, and region.”
Status: Suggested prompt for users to test themselves.
“Which customer accounts had the largest decrease in usage or revenue over the last 90 days?”
Status: Suggested prompt for users to test themselves.
“Find customers with increasing product usage over the last 60 days but no recent plan upgrade or expansion.”
Status: Suggested prompt for users to test themselves.
“Which customer segments generated the highest average revenue per account this year?”
Status: Suggested prompt for users to test themselves.
| Feature | What it does | Why it matters |
|---|---|---|
| AI Analyst | Lets users ask plain-English questions and receive SQL-backed answers | Makes data access easier for non-technical teams |
| Knowledge Graph | Organizes datasets, joins, and business logic | Helps the AI interpret questions correctly |
| Governed Metrics | Defines trusted KPI logic across dashboards and AI queries | Reduces inconsistent metric definitions |
| Suggested Questions | Recommends follow-up questions based on KPIs, dimensions, and business terms | Helps users explore data without knowing where to start |
| Dashboard Saving | Saves generated charts into dashboards for tracking | Turns one-off analysis into reusable reporting |
| Chart Editing with AI | Lets users modify visualizations through natural-language instructions | Reduces friction when refining reports |
Athenic’s docs show that users can generate answers, save charts to dashboards, customize dashboard layouts, modify charts with AI, and review team query history with generated SQL and results.

Athenic AI is a self-service analytics platform. Users connect data sources, create an AI Analyst, define relevant datasets, add business context, and then ask questions in plain English. Athenic translates those questions into SQL, runs the query, and returns results as tables or interactive charts.
That makes it different from a standard BI dashboard. Traditional dashboards are useful when you already know the metrics you want to monitor. Athenic is more useful when a business user has a fresh question: “Why did churn increase?”, “Which customer segment is underperforming?”, “What changed in retention last month?”, or “Which products drove revenue this quarter?”
The tool is aimed at companies that want more people to explore data directly while still keeping logic controlled. That balance matters. AI analytics tools can become risky if every question creates its own version of a metric. Athenic tries to avoid that through governed metrics, dataset configuration, key terms, default question prefixes, and Knowledge Graph setup.
Athenic is strongest when teams already have useful data but too many questions still flow through analysts. Product, growth, finance, sales, operations, and customer success teams often need quick answers, but the data lives in warehouses, databases, spreadsheets, or dashboards that non-technical users do not want to navigate.
Athenic’s best role is reducing that gap. It gives business users a plain-English interface while giving data teams a way to define how the AI should understand tables, joins, fields, business rules, and KPIs. The AI Analyst setup process includes selecting datasets, adjusting field names and data types, removing irrelevant or sensitive fields, defining relationships, and linking data to business-friendly concepts.
That makes the platform more serious than a generic chatbot connected to a spreadsheet. The setup work is part of the value. Athenic performs better when the data team has taught it the business meaning behind the data.
The Knowledge Graph is the part of Athenic that deserves the most attention. It is where users define how datasets connect, what fields mean, which joins are valid, and how business concepts should map to raw data. Athenic’s AI Analyst documentation says datasets are the foundation of the Knowledge Graph, and that teams can annotate fields, define joins, and map KPIs and terminology so the AI can interpret natural-language questions more accurately.
This matters because business data is rarely obvious. A column name like status, segment, or active_user may mean different things across teams. A churn calculation may depend on date logic, subscription state, product tier, or account type. If the AI guesses, it may produce a confident but misleading answer.
Athenic’s Knowledge Graph gives teams a place to make those assumptions explicit. That does not remove the need for data modeling, but it makes AI analysis more controlled and repeatable.
Governed Metrics are another important part of Athenic’s platform. Athenic defines them as official, trusted definitions of business metrics, including the calculation, underlying data sources, filters, business logic, supported dimensions, entities, and time grains.
This is one of the stronger features for companies that care about trust. Without governance, different teams can calculate the “same” metric in different ways. Dashboards disagree. Analysts spend time reconciling definitions. AI tools may return different answers depending on phrasing. Athenic’s governed metrics are designed to create one consistent definition that can be reused across dashboards, reports, and AI-driven analysis.
That is especially useful for metrics like ARR, retention, churn, activation, cohort performance, margin, pipeline, and revenue. These are not just numbers. They affect decisions.
Athenic supports several types of data inputs. Its documentation lists SQL databases such as PostgreSQL, MySQL/MariaDB, Microsoft SQL Server, and PlanetScale. It also documents warehouse connections for Amazon Athena, Snowflake, and Google BigQuery. For lighter use cases, Athenic supports Google Sheets and CSV uploads, with CSV uploads limited to 100 MB total in the documented setup flow.
The setup process is not hard to understand, but it is not zero-effort. Teams need to choose relevant tables and fields, define relationships, remove sensitive or irrelevant columns, and add context. That is a reasonable trade-off. A BI tool that promises instant answers without any semantic setup can be attractive at first, but it often fails when business logic gets complicated.
Athenic is a strong fit for SaaS teams that need retention, cohort, churn, activation, and product usage analysis without routing every question through data analysts.
It also works well for operations and finance teams that need repeatable KPI tracking, dashboard reporting, and fast answers to performance questions.
Growth and marketing teams can use it to explore campaign performance, customer segments, acquisition sources, and funnel movement.
Product teams can use Athenic to investigate feature adoption, user behavior, account health, and segment-level changes.
It is less useful for teams with messy, undocumented data and no willingness to define metrics. Athenic can help people ask better questions, but the underlying data still has to be usable.
Athenic’s main limitation is setup dependency. The AI Analyst works best when datasets, joins, key terms, and governed metrics are configured well. If the setup is rushed, answers may be less reliable.
The second trade-off is that self-service analytics still needs guardrails. Business users may ask broad or ambiguous questions, and the AI may need clarification around date ranges, filters, definitions, or segments. Athenic supports key terms, suggested questions, and default question prefixes to help with this, but teams still need clear data governance.
The third limitation is cultural. Athenic can reduce analyst bottlenecks, but it does not replace analysts. Analysts still matter for data modeling, validation, metric design, complex investigations, and teaching the organization how to ask better questions.
Athenic AI is best for teams that want self-service analytics without giving up metric control. Its strongest value comes from the combination of plain-English data questions, SQL-backed answers, interactive charts, dashboards, a Knowledge Graph, suggested follow-ups, and governed metrics. It is a strong fit for SaaS, product, growth, operations, finance, and customer-facing teams that have useful data but too much analyst dependency. The main caveat is setup quality. Athenic becomes more valuable when the data foundation is clean, business terms are defined, and metrics are governed. Without that work, it risks becoming another AI layer on top of unclear data.
TAGS: Productivity
Related Tools:

Corrects data-entry errors

Combines web browsing with an integrated AI assistant

Summarizes meetings to help teams capture key information

AI-driven scriptwriting software

Email tool that summarizes long threads and offers smart reply
Streamlines note-taking, task organization, and insight generation